Tenant Satisfaction Measures
Supported by a market-research provider (Service Insights), we carried out a Tenant Satisfaction Survey in November-December 2025, using a mix of 820 phone calls and 325 online surveys. Overall, we managed to get the views of 1,145 tenants. A huge thank you to everyone who took part!
With over 40% of our 2,855 tenants taking part it has given us a great insight into what our customers think of the service we provide and where we can improve.
Tenant Satisfaction Measures (TSMs) were introduced in 2023/24 by The Regulator of Social Housing for all landlords in England. The purpose is to ensure landlords focus on the customer experience; check performance against the new consumer standards and to provide transparency to our residents on how we are performing.
For us, it is an opportunity to gather meaningful feedback from you on how we are doing and to use that feedback to shape the services we deliver.
We commissioned our Tenant Satisfaction Measures (TSMs) survey in line with the requirements provided by the Regulator of Social Housing and the Market Research Society Code of Conduct. As a landlord with more than 1,000 homes we submitted our results to The Regulator as required in June this year.
We will keep you updated as we make progress on the improvements, we are putting in place, and will be working with our Tenants Voice Group to develop those plans.
If you want to get involved in helping us shape our services you can find the details below.
|
Measure |
TSM scores |
|
TP01: Proportion of respondents who report that they are satisfied with the overall service from South Derbyshire District Council housing services |
69.9% |
|
TP02: Proportion of respondents who report that they are satisfied with the overall repairs service from South Derbyshire District Council housing services over the last 12 months |
75.3% |
|
TP03: Proportion of respondents who report that they are satisfied with the time taken to complete their most recent repair after they reported it |
72.4% |
|
TP04: Proportion of respondents who report that they are satisfied that South Derbyshire District Council housing services provides a home that is well maintained |
72.5% |
|
TP05: Proportion of respondents who, when thinking about the condition of their property or the building they live in, report that they are satisfied that South Derbyshire District Council housing services provides a home that is safe |
80.8% |
|
TP06: Proportion of respondents who report that they are satisfied with South Derbyshire District Council housing services listening to their views and acting upon them |
65.1% |
|
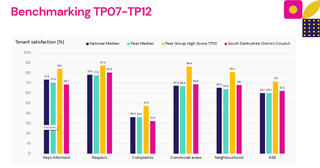
TP07: Proportion of respondents who report that they are satisfied with South Derbyshire District Council housing services keeping them informed about things that matter to them |
68.7% |
|
TP08: Proportion of respondents who report that they agree with the statement: “South Derbyshire District Council housing services treats me fairly and with respect" |
80.6% |
|
TP09: Proportion of respondents who report that they are satisfied with South Derbyshire District Council housing services approach to complaints handling |
32.4% |
|
TP10: Proportion of respondents who report that they are satisfied South Derbyshire District Council housing services keeps communal areas clean and well maintained |
68.8% |
|
TP11: Proportion of respondents who report that they are satisfied South Derbyshire District Council housing services make a positive contribution to their neighborhood |
68% |
|
TP12: Proportion of respondents who report that they are satisfied with South Derbyshire District Council housing services approach to handling anti-social behavior |
62.2% |
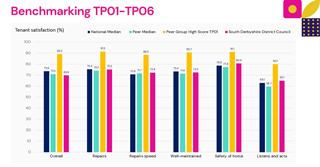
We also wanted to see how we compared with similar councils across the Midlands and the graphs below show how we compared on the 12 questions against the national picture and our regional peers. We score similarly to our peers, which shows the challenges that we are all facing. There is always room for improvement in our service areas, but we are proud of where we have come from, with some of our scores from (the original survey) 2024 rising by 10%.
The benchmark has now been set and we can use these figures to compare with next year when the survey is carried out again to make sure we are making the progress we need to make.
TP09 Your satisfaction with our approach to Complaints
The Housing Ombudsman published a new Complaint Handling Code on 8 February 2024 and from April 2024 we followed that code, and changed how we manage complaints as a result. We are always working hard to find better ways in which to handle complaints, and it's a testament to this work that has seen the satisfaction with complaint handling rise from 23.5% in the 2023/24 survey to 32.4% in 2025/26.
TP06 Listening to your views and acting upon them
We restarted The Tenants Voice Group in June 2024 and a number of members have now joined the group. We always need more members, so please get involved if you can! We now provide a regular Housing newsletter, which aligns with our quarterly Housing Roadshows, drop-in sessions and special coffee mornings in different parts of the District. We are doing as much as we can to offer 'touchpoints' for tenants, with opportunities for face-to-face conversations with our teams, and those wider services and charities that are available locally.
Council Performance
As well as the survey we also had to submit how we performed on building safety checks, anti-social behavior cases, repairs delivery and how quickly we resolved complaints as of the end of March 2026 and our results are shown below.
|
Measure – Building Safety Checks |
2024/25 |
2025/26 |
|
BS01: Proportion of home for which all required gas safety checks have been carried out. |
100% |
100% |
|
BS02: Proportion of home for which all required fire risk assessments have been carried out. |
100% |
100% |
|
BS03: Proportion of home for which all required asbestos management surveys or re-inspections have been carried out. |
100% |
100% |
|
BS04: Proportion of home for which all required legionella risk assessments have been carried out. |
100% |
100% |
|
BS05: Proportion of home for which all required communal passenger lifts safety checks been carried out. |
100% |
100% |
|
Measure – Anti-social behaviour |
2024/25 | 2025/26 |
|
NM01 (1): Number of anti-social behavior cases, opened per 1,000 homes. |
22.5 |
26.9 |
|
NM01 (2): Number of anti-social behavior cases that involve hate incidents opened per 1,000 homes |
0.7 |
0.3 |
|
Measure – Decent Homes Standard and Repairs Service |
2024/25 | 2025/26 |
|
RP01: Proportion of home that do not meet the Decent Homes Standard. |
Nil Return |
5% |
|
RP02 (1): Proportion of non-emergency responsive repairs completed within the landlord’s target timescale [LCRA only] (%) |
65% |
61.37% |
|
RP02 (2): Proportion of emergency responsive repairs completed within the landlord’s target timescale [LCRA only] (%) |
86.6% |
91.57% |
|
Measure - Complaints |
2024/25 |
2025/26 |
|
CH01: Number of stage one complaints received (per 1,000 homes). |
9.9 |
4.2 |
|
CH02: Number of stage two complaints received (per 1,000 homes). |
1.7 |
0.6 |
|
CH03: Proportion of stage one complaints responded to within the Housing Ombudsman’s Complaint Handling Code timescales. |
100% |
100% |
|
CH04: Proportion of stage Two complaints responded to within the Housing Ombudsman’s Complaint Handling Code timescales. |
100% |
100% |
Should you require further information or have any queries please contact the Council using our Consumer Standards inbox.
Consumer Standards ConsumerStandards@southderbyshire.gov.uk.